215-348-9031
| 2003 S. EASTON ROAD | SUITE 308
|
DOYLESTOWN, PA 1890
SEARCH
About BCEDC
Board of Directors
History
Directions
About Bucks County
Life in Bucks County
Government
Municipalities
Legislators
Congress & Senate
BUCKS COUNTY COMMISSIONERS
Health Care
Education
Housing
Bucks County Facts
Demographics
Labor/Employment
Largest Employers
Taxes
Transportation
Utilities
Future of Bucks County
Properties
Property Search
News & Events
Newsletter
October 2024
August 2024
June 2024
March 2024
January 2024
November 2023
September 2023
July 2023
May 2023
March 2023
January 2023
November 2022
August 2022
June 2022
April 2022
January 2022
News You Can Use
Events
Resources
State and Local Government
Chambers of Commerce & Conference Visitor's Bureau
Business Development
Education and Workforce
Research Information
Local Governments in Bucks County
Bucks County Legislators
Publications
Related Links
TELECOM ASSESSMENT
Zoning Map
Partners
Contact Us
Labor/Employment
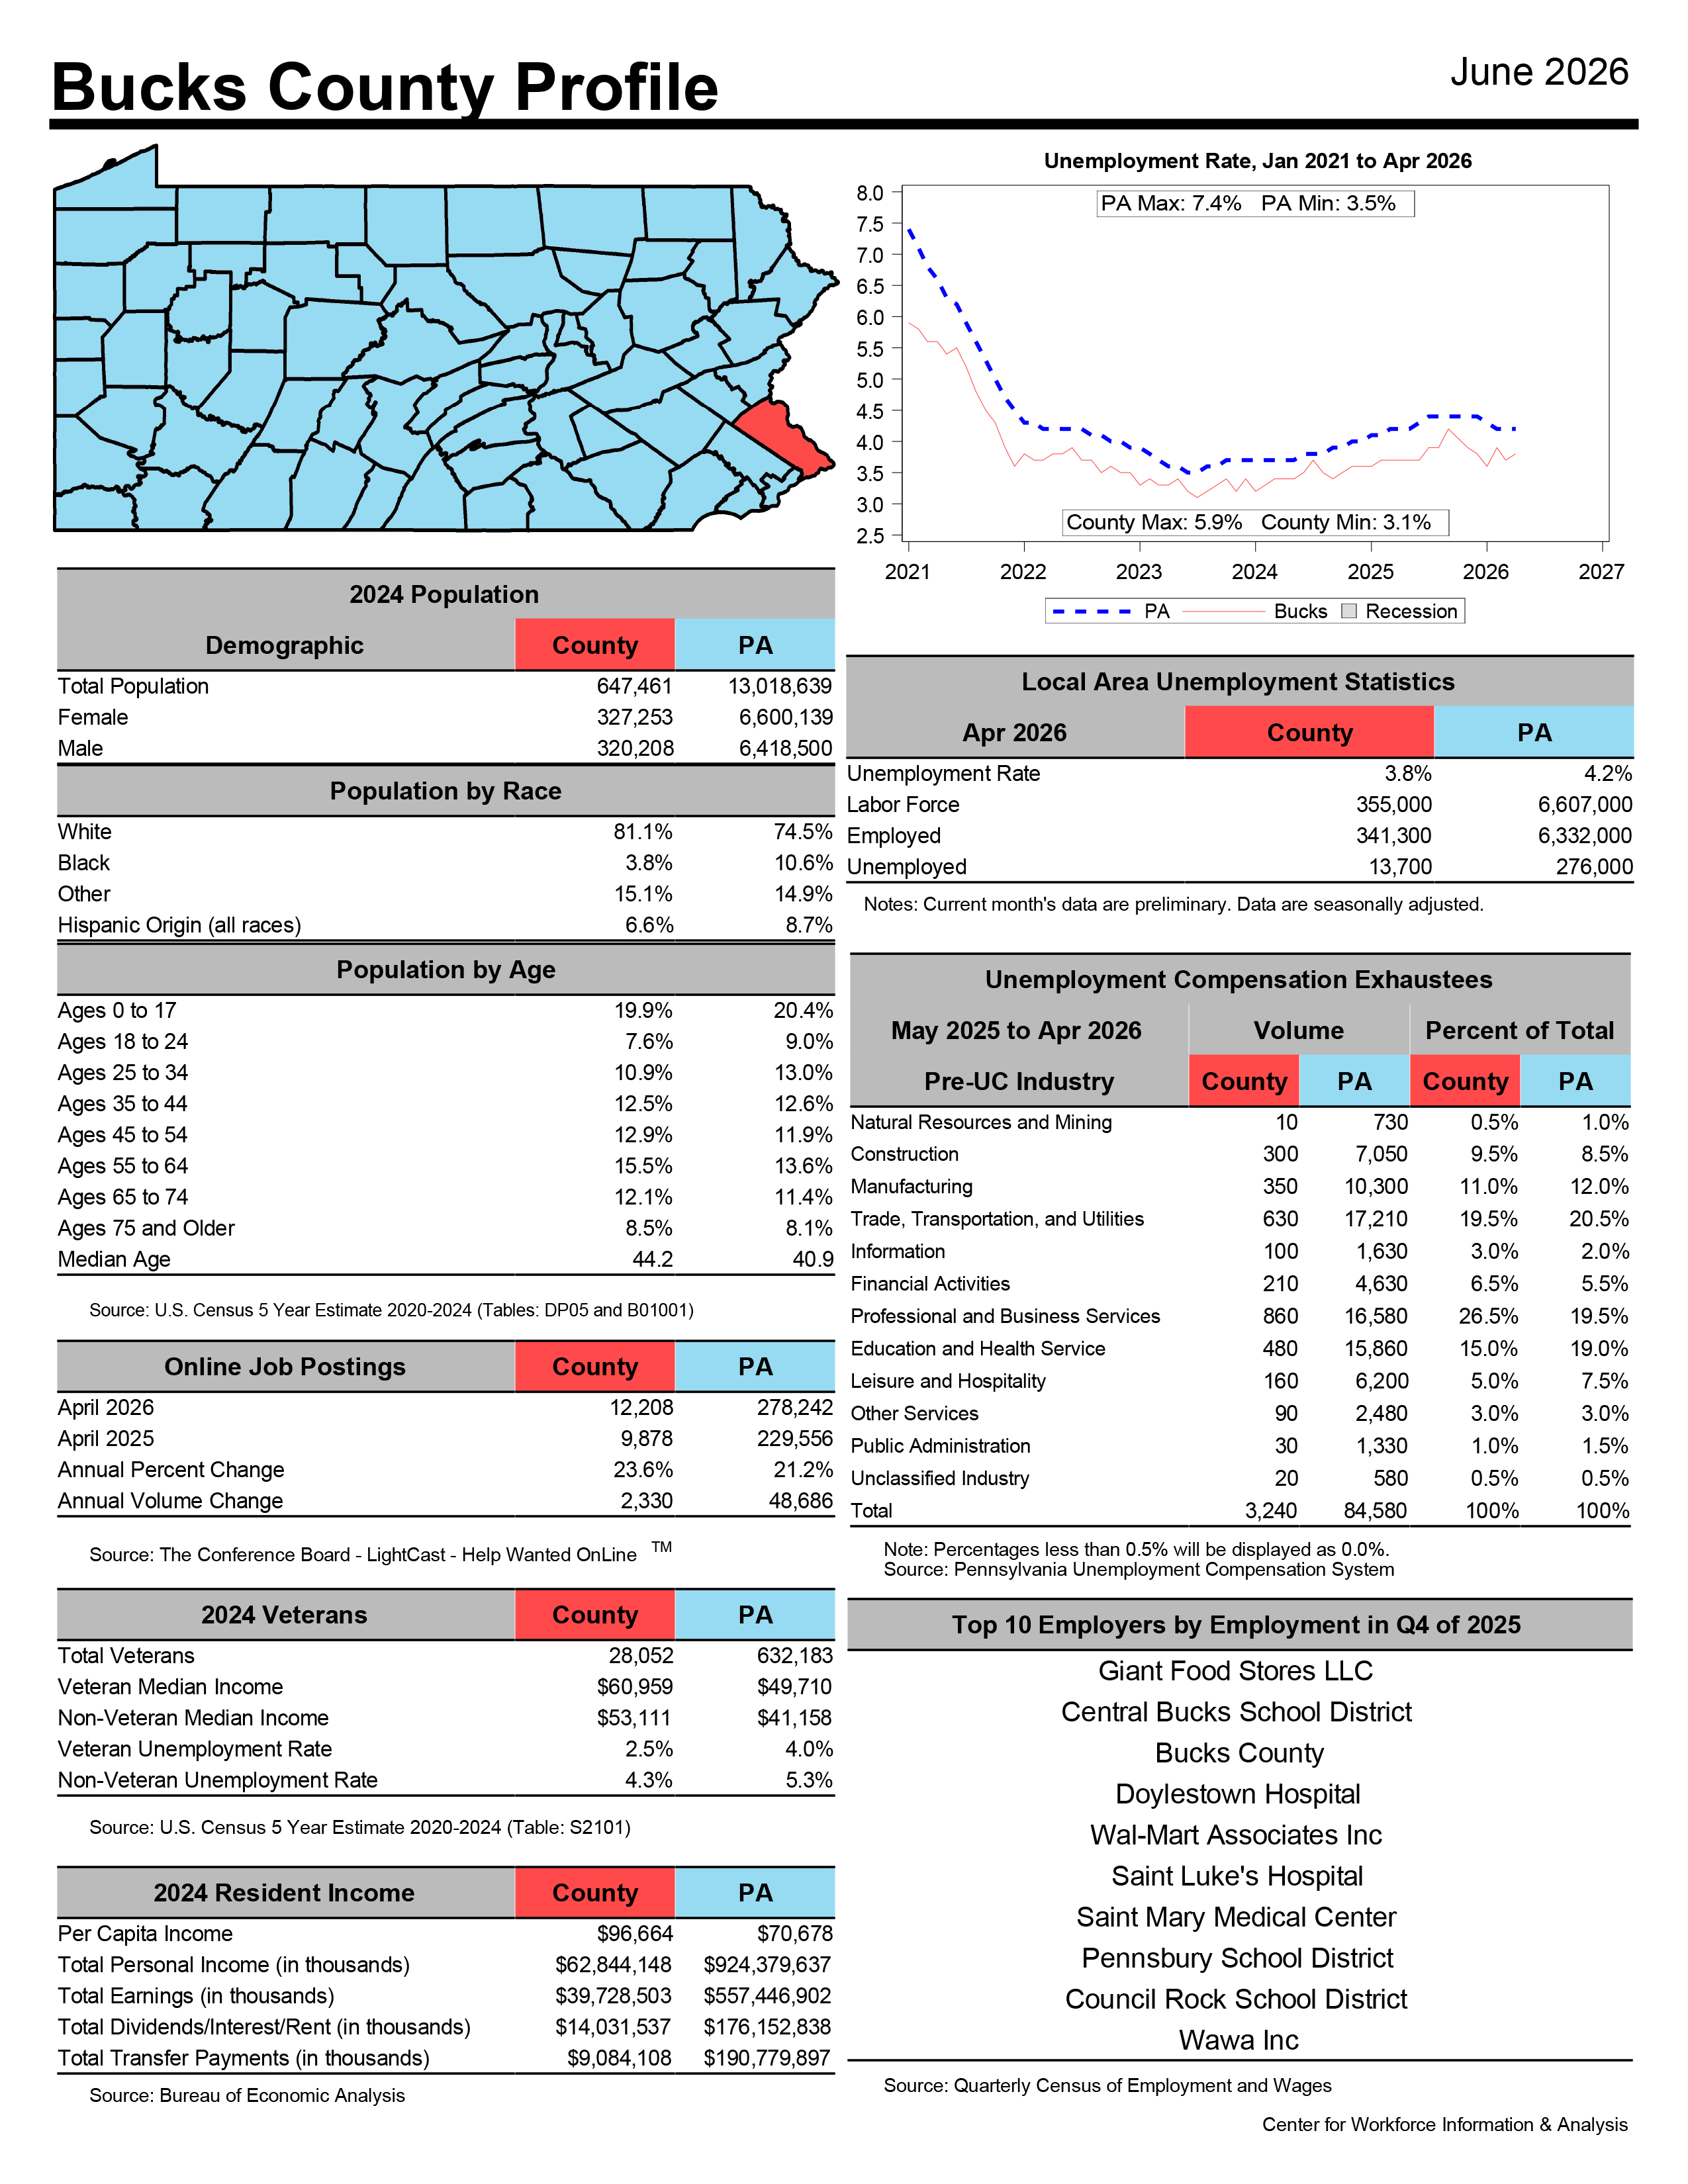
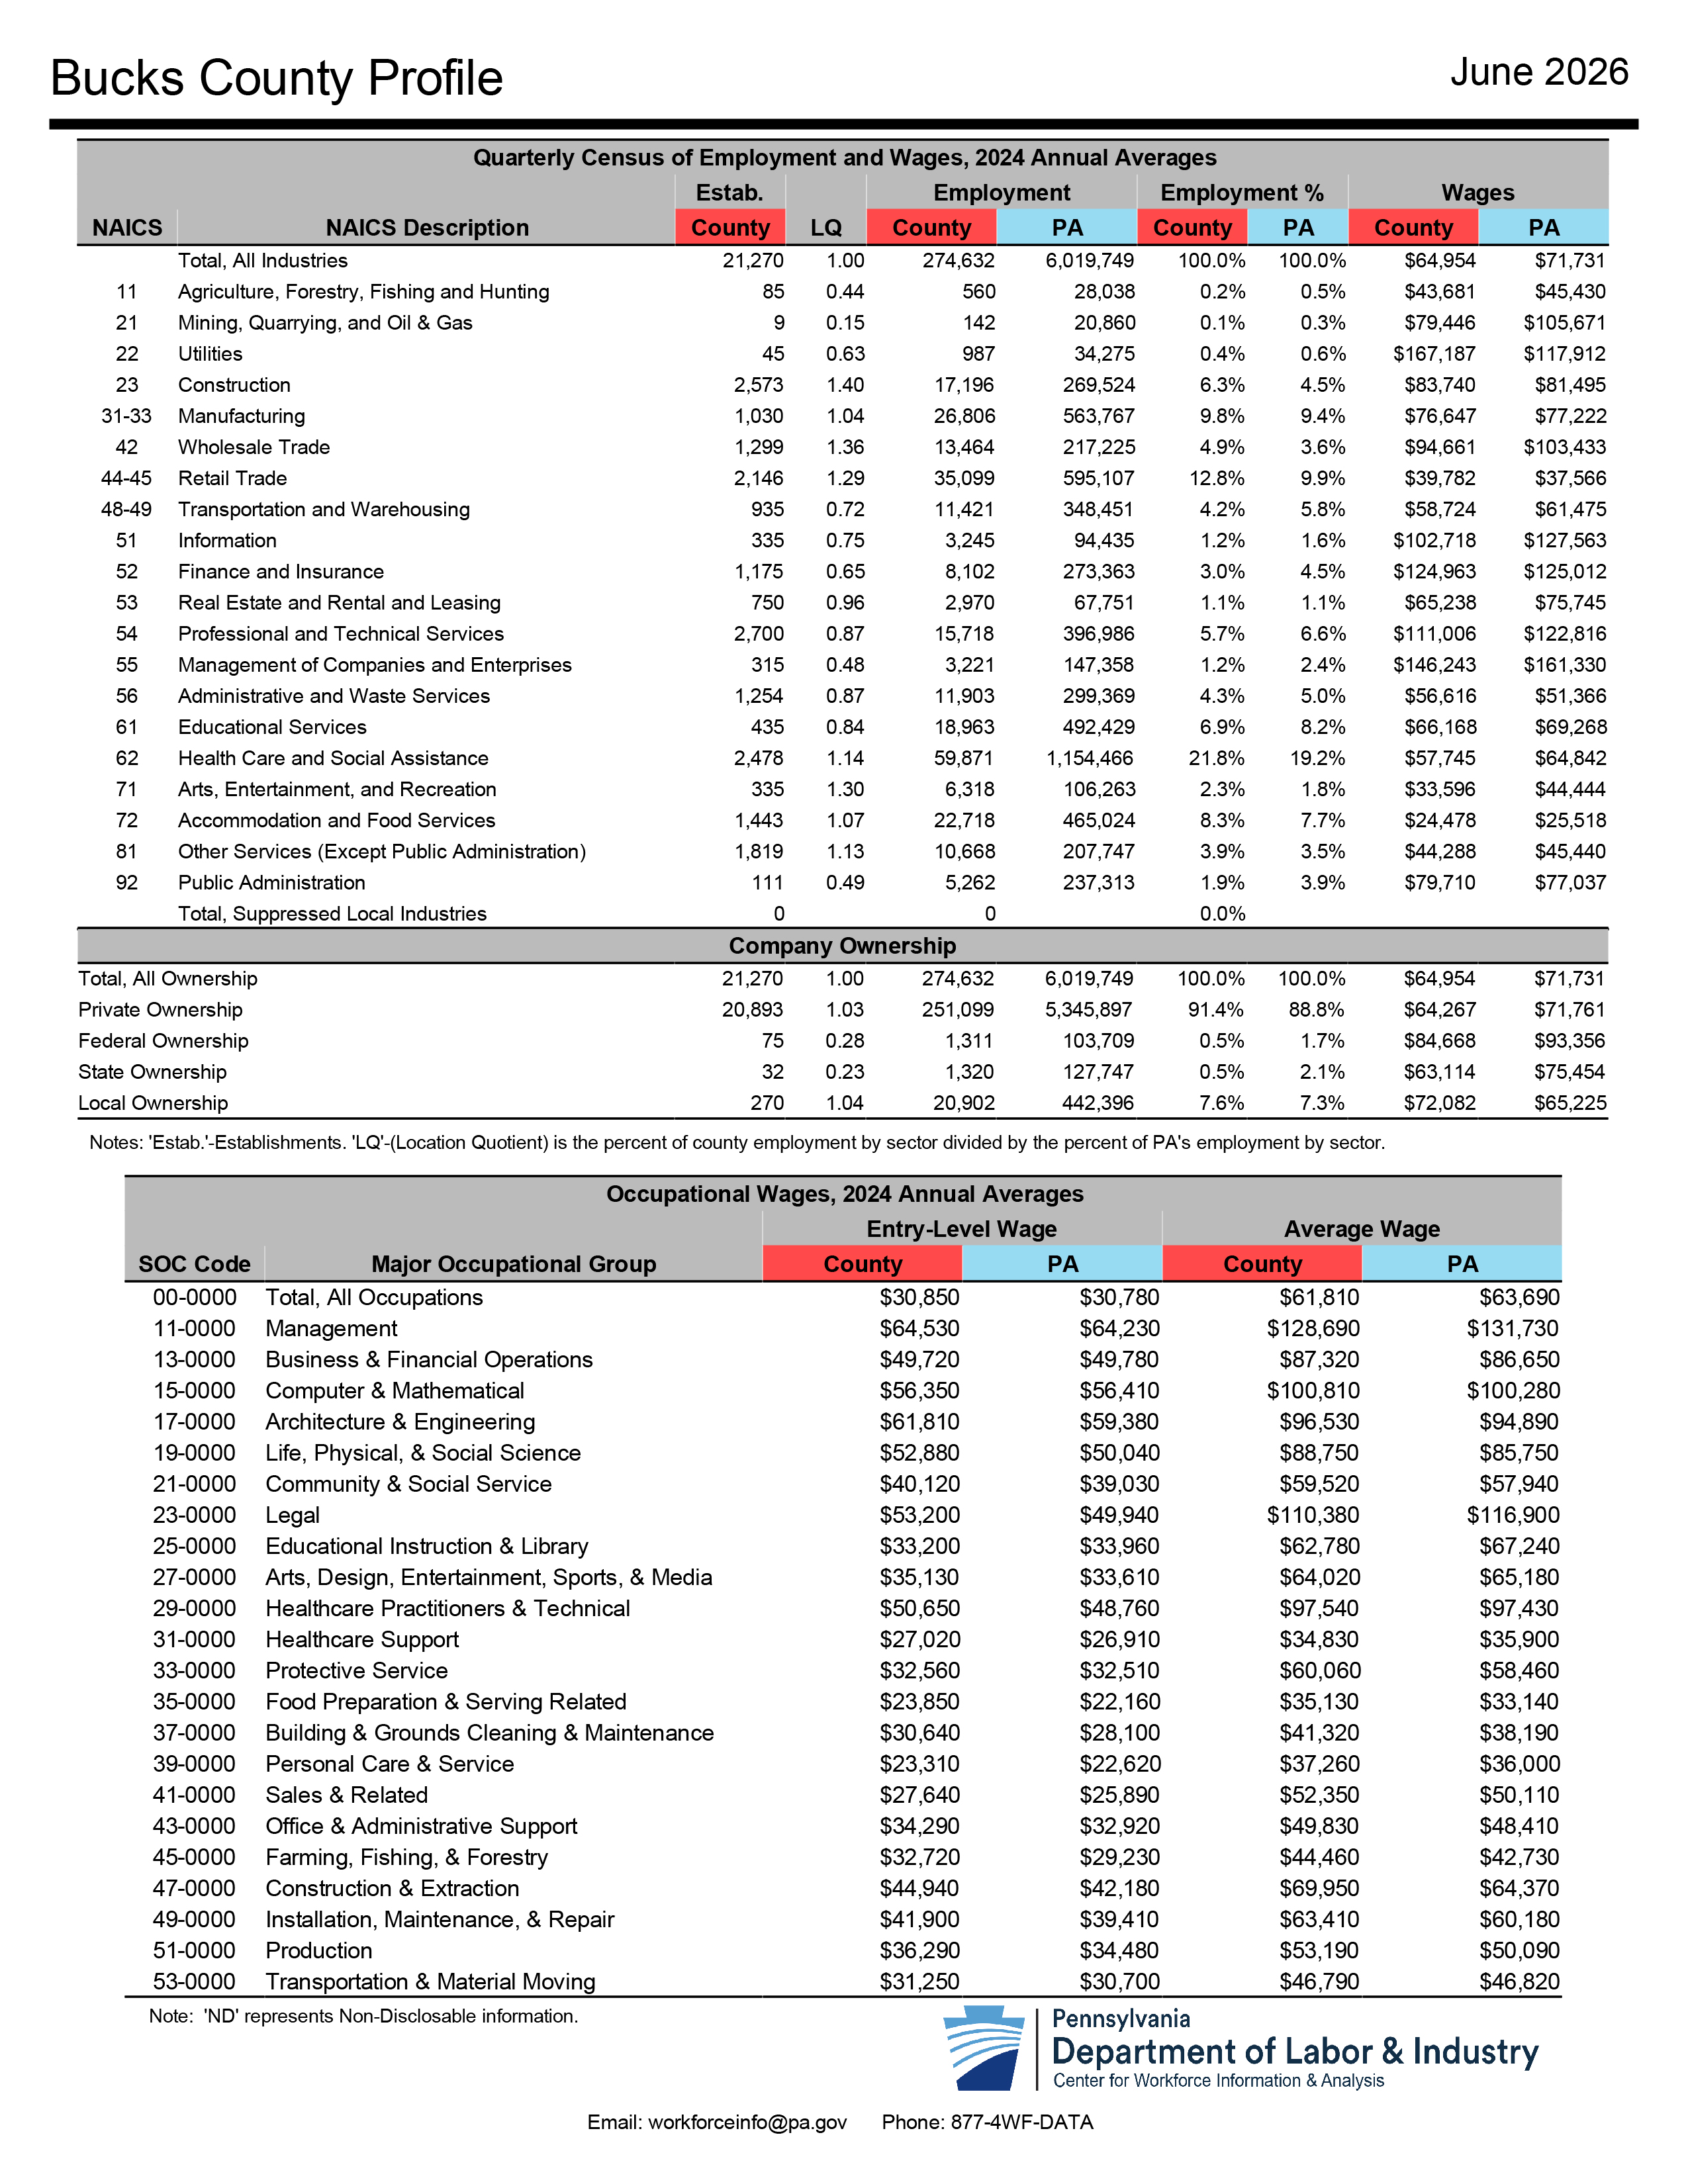
Click images to open larger and download.
About BCEDC
Board of Directors
History
Directions
About Bucks County
Life in Bucks County
Government
Municipalities
Legislators
Congress & Senate
BUCKS COUNTY COMMISSIONERS
Health Care
Education
Housing
Bucks County Facts
Demographics
Labor/Employment
Largest Employers
Taxes
Transportation
Utilities
Future of Bucks County
Properties
Property Search
News & Events
Newsletter
October 2024
August 2024
June 2024
March 2024
January 2024
November 2023
September 2023
July 2023
May 2023
March 2023
January 2023
November 2022
August 2022
June 2022
April 2022
January 2022
News You Can Use
Events
Resources
State and Local Government
Chambers of Commerce & Conference Visitor's Bureau
Business Development
Education and Workforce
Research Information
Local Governments in Bucks County
Bucks County Legislators
Publications
Related Links
TELECOM ASSESSMENT
Zoning Map
Partners
Contact Us
This website uses cookies that are necessary to its functioning and required to achieve the purposes illustrated in the privacy policy. By accepting this OR scrolling this page OR continuing to browse, you agree to our
privacy policy
.
Ok
Decline