Bigger Data, Better Information
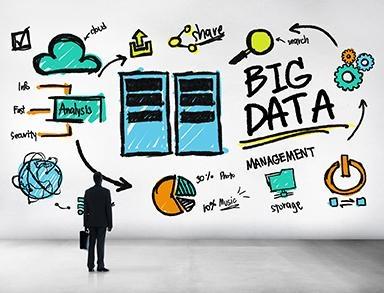
Big Data is at the very least an elusive term. What is considered big today may be not-so-big in the near future. The same principle applies to data processing in general, given the ever increasing demands on business to anticipate customer needs and respond to changes in the market place. For the purposes of this narrative, perhaps the following definition from the Wikipedia web site will suffice: a broad term for data sets so large or complex that they are difficult to process using traditional data processing applications.
Borrowing again from the Wikipedia web site, size and complexity are not the only critical aspects of Big Data. In addition to volume and variety, three other V’s are often in play: velocity, variability, and veracity. Velocity refers to the speed at which data is generated, variability to the sometimes inconsistent nature of data, and veracity, or the quality of the data. At the core of pulling all of this together is the analysis performed by those familiar with the business aspects of the data and those charged with its transition into an actionable strategy.
 Difficult to process indeed, and why should I care about V’s? What does any of this have to do with my business and my current method of generating reports? The answer may lie in what could be locked away in those reams of data that remains dormant month after month but could reap enormous benefits if only brought to light. The way that the data is formatted into a functional reporting structure could make all the difference.
Many tools are currently in use with the aim of making this very difference. Unfortunately the tools being used can become the primary focus subordinating the data being processed. Have you ever wanted to see a report in a particular format or a chart to convey emphasis but had to settle for something less due to the shortcomings of the processing tools? It is at this point in an organization’s development that the critical questions arise: do we upgrade to an expensive alternative or do we continue to make do with what we have?
You may not be surprised to learn that there is another option, an alternative method to generating reports. These are replacement processing tools in the form of freeware, software available on the web, accessible to anyone, and downloadable to almost any computer. Some of the more popular freebies include the R Programming Language and Python. There is however need for caution, although they are free of charge and effective, all of the options have a fairly steep learning curve.
So, Big Data in all its grandeur presents the usual challenges and trade-offs. Do the benefits gained from newly discovered statistics and patterns in our data justify the investment in new technology? What are the opportunity costs of not pursuing alternative methods? The solution of course depends on where your business is in its development and where you want it to be. Good luck and good decision making.
Article written by Thomas Reilly, datatooinfo, Data Analyst, datatooinfo@gmail.com, 215.292.8011.

